
“What is the best time frame to trade Forex?” is a frequently asked question among FX traders, especially those who are new to the market. The truth is that there is no single answer. It all depends on your preferred strategy and trading style.
Traders take advantage of different timeframes to speculate on the forex market. The two most popular time frames are the long time frame and the short time frame, which are used respectively as the trend determination and entry time frames. Trend-defining timeframes are long time frames that help traders identify trends, while entry timeframes help traders choose reasonable entry points. This article will introduce readers to an in-depth look at trading timeframes, and share experiences for using timeframes to serve your trading goals.
The main content mentioned in the article:
- How to choose the most suitable time frame?
- Main trading time frame
- Using multi-timeframe analysis
How do I choose a time frame?
As mentioned above, the best time frame for forex trading will vary depending on the trading strategy you use to meet your specific goals. The table below summarizes the variable forex timeframes used by different traders to determine trends and entry points:
| Time frame | Day Trading | Swing Trading | Position Trading |
| Identify trends | 30 min – H4 | Daily | Weekly |
| entry point | 5 min – H1 | H2 – H4 | Daily |
Main trading timeframes
Different trading strategies will determine the timeframe that should be used. For example, a day trader’s order holding time will be significantly shorter than that of a swing trader.
1. Time frame for Position Traders
The timeframe for traders using a position trading strategy can range from days to years with the definition of “long-term”.
Many new traders tend to avoid this approach because it means a long wait before knowing the trading results. However, for many accounts, short-term (intraday) trading can be very challenging and requires more time to develop a strategy.
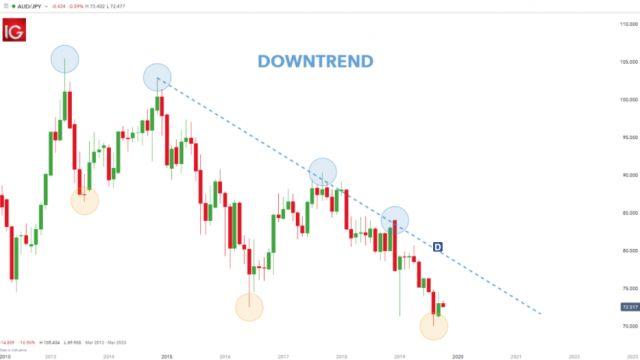
Position Traders can use the monthly chart to identify trends and the weekly chart to select potential entry points.
Example of Position Trading
Once the trend has been identified on the monthly chart, traders can look to enter on the weekly chart. Many traders look to use Price Action (as seen in the weekly chart below) to identify trends and entry points, indicators can also be applied at this time frame.

2. Time frame for Swing Traders
Once familiar with long-term charts, traders can approach slightly shorter timeframes and suitable holding periods. This can create a lot of volatility in a trader’s approach, so risk management should be warranted before switching to shorter trading timeframes.
Swing Trading is a medium-term trading strategy and it has the advantages of both short-term and long-term trading without suffering the weakness of both schools. Swing traders will check the chart a few times during the day in case there are any major fluctuations during the day. This gives the advantage of not having to monitor the market constantly. After identifying a trading opportunity, traders place an order with a stop loss and will monitor the trading progress in the following period.
One advantage of this method is that traders still regularly check the chart to catch opportunities. That eliminates the weakness of long-term trading, where entry timeframes are mostly weekly or daily timeframes.
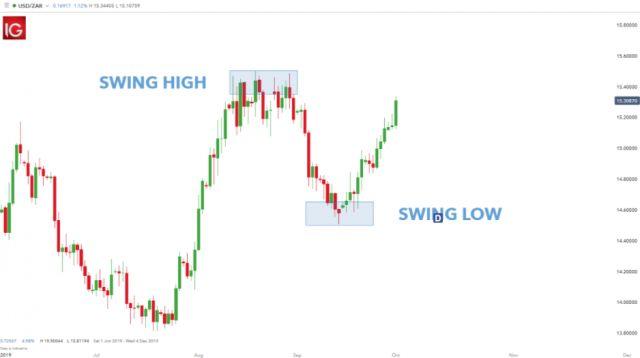
Swing Trading Example

3. Time frame for Day Traders
Day Trading can be one of the most difficult strategies to make a profit. Newer traders who are implementing day trading strategies are having to make more frequent trading decisions that may not have been practiced in the long run. This combination of inexperience and high frequency leads to losses that could have been prevented if a trader had taken a slightly slower approach like swing trading.
A Day Trader or Scalper is in the inevitable position of price moving rapidly in the direction of the trade. As a result, day traders are bound to the charts as they look for the market’s trend for that day. Obsessed with tracking charts for long periods of time can lead to stress and fatigue. However, the short-term approach also results in a shorter stop loss.
In general, there is less profit potential in a short-term trade, resulting in a tighter stop loss. Tighter stop-losses mean a higher probability of a failed trade than a long-term trade. To trade with short timeframes, traders should familiarize themselves with Swing trading and Position trading strategies before moving down to short timeframes.
Similar to long-term trading, day traders can look to gauge trends on the hourly chart and identify entry opportunities on “minute” timeframes like the 5- or 10-minute charts. The 1-minute timeframe is also an option, but extreme caution should be exercised as changes on the 1-minute chart can be very random and difficult to handle. Again, traders can use a variety of entry frames to open positions once the trend has been determined – price action or technical indicators.
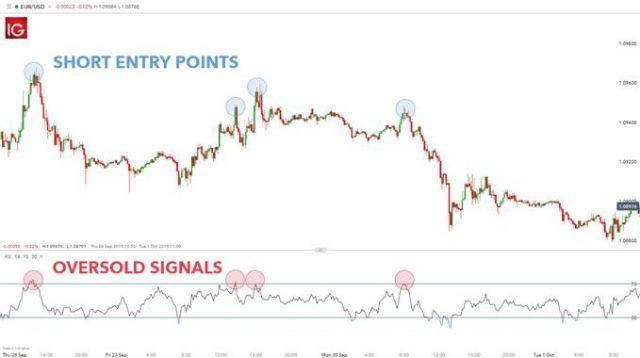
Example of day trading
The charts below use the hourly chart to identify trends – prices below the 200-day moving average indicate a downtrend. The second 10-minute chart uses the RSI to support short-term entry points. In this case, the trader is only identifying overbought signals on the RSI (highlighted in red) due to the longer-term previous downtrend.

Using multi-timeframe analysis
The best timeframe for Forex trading does not necessarily mean a specific timeframe. It is possible to combine approaches to finding opportunities in the Forex market.