
Western economic development is famous for its systematization and high science, in the East there is also a system full of philosophy and science. It’s Ichimoku – System of Magic Clouds
In the midst of a vast jungle of the technical analysis world, there are hundreds and thousands of indicators as well as trading systems and charts. Most of them were developed in the West, the birthplace of modern technical analysis with computer systems that offer the ability to backtest large amounts of data. However, a system that is not fussy, but still includes enough science mixed with Eastern philosophies. Besides the Japanese candlestick chart, this system brings Eastern technical analysis to the world, it is called Ichimoku.
What is Ichimoku? What makes blue and red clouds?
Ichimoku, full name is Ichimoku Kinko Hyo. This system was invented by Goichi Hosoda – a journalist. Obviously from the name, there were no clouds at all. So what makes clouds? I’m going to give you a brief explanation shortly, and I’ll try to explain what I know in a way that’s easy to understand.
Elements that make up a basic Ichimoku chart
In this section, I will show you how to calculate and create elements in Ichimoku. If you are a simple user, you can skip this part.
Unlike moving averages, the main lines in the Ichimoku system use highs and lows, rather than closing prices. Although their construction is similar.
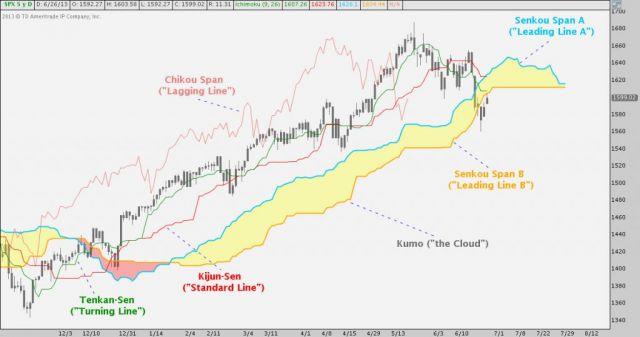
- Kijun-sen (or Standard Line): Standard line, this can be considered a moving average with a long period. Its formula is as follows: Kijun-Sen = (Highest Price + Lowest Price)/2, and then the value is calculated for 26 sessions with the same calculation of the moving average.
- Tenkan-sen (or Signal Line): The conversion line, or signal line, can be thought of as an average with a short period, giving signals faster. Calculation formula: Tenkan-Sen = (Highest Price + Lowest Price)/2, averaged for 9 sessions.
- Chiko Span (or Lagging Line): Lagging line, this can be considered as a confirmation signal line for the trend, because of its lag. Calculation formula: Chikou Span = Current closing price, plotted 26 sessions back.
Senko Span A (leading line A). Calculation formula: Senkou Span A = (Tenkan-Sen + Kijun-Sen)/2, represented on the chart by moving forward 26 sessions. - Senko Span B (leading line B): Along with Senko Span A, the intersection of these two lines creates areas shaped like clouds (Kumo). Calculation formula: Senkou Span B = (Highest Price + Lowest Price)/2, calculated for 52 sessions, plotted 26 sessions forward.
A system with many components, creating a beauty of Eastern culture, of the Japanese people, that is the beauty of the spirit of collective work. And this collective, creating a great power of the Ichimoku system, is the “balance”. So to understand how this balance is expressed, let’s learn about the philosophy of the Ichimoku system as well as the three pillar theories, namely time theory, wave theory, and price target theory. .
The philosophy of the Ichimoku system
The first philosophy – Balance
Unlike Western Technical Development, Goichi Hosoda believes that what influences the market, what drives the market is time, this is the core element of Ichimoku. And since clouds (Kumo) are extracted from price and time, in my opinion, it does not have the meaning or role of “resistance” or “support” as we think. All factors are driven by time – and from time to forming market cycles. The balance between time is when all three “past”, “present” and “future” (Chiko, Tenkan, Kijun and Kumo lines) agree to represent that balance. At that time, the new market is truly “Kinko”, ie a trending market, and stable equilibrium. When both “past”, “future” and “present” disagree and overlap, then there is chaos. Hosoda believes that this is an imbalance of the market in terms of time factor.
Second philosophy – Go with the flow and follow the balance
The Japanese have a habit, that when eating fish, they never eat the head and tail, but they only eat along the body because the head and tail parts are difficult to eat, less nutritious and hard. In trading, too, the beginning and the end of the trend are the “head” and the “tail”, which always hides chaos, while the area with the greatest profit potential is the “fish body”. Every market has a cycle and follows that cycle, which is Chaos – Balance – Chaos. Always avoid trading at the point of chaos and instead embrace the new balance is what Hosoda wants to achieve in his system.
To summarize, in my opinion:
- Ichimoku should not be a trading system based on breakouts through support, resistance, and resistance levels, it should be a Trend-following system.
- Component lines are only effective when combined with each other, and their extraction comes from the average of time and price, so they do not act as support or resistance areas.
So to know about the cycle, as well as when the market reaches equilibrium, let’s go to the first pillar in the tripod of the Ichimoku system, the first and also the theory. the most important of the three main theories of Ichimoku – the theory of time.
Time theory
The theory of time is divided into two main types of cycles and two variations. In 1930, Hosoda and his “supercomputer” were a small group of students, who performed math operations every day with the number of operations that it seemed that the students were just “eating, sleeping, Go to the bathroom and do the math for Hosoda.” Finally, they have found the secret of the “balance” they want to work towards. It is the optimization of the market based on cycles that obey the laws of time theory. And in 1968, Hosoda announced its system.
The first type of cycle number, Kihon Suchi.
Kihon Suchi is a set of period numbers that Hosoda has spent many years studying, and evaluates this as the most suitable set of numbers for the equilibrium theory that he proposed.
Kihon Suchi series of numbers: Kihon Suchi series of numbers includes up to 10 numbers – 9, 17, 26, 33, 42, 65, 76, 129, 172, 200, 257. In which the 3 most important numbers are 9, 17, 26 You may notice that, between the numbers in the above series, there is a relationship as follows: Numbers in the Kihon Suchi series are usually calculated according to the minimum period sum of 9 (and can be) plus or minus 1-2. session. We have 9+9-1=17,17+9=26.

As you can see in the picture, coincidentally, the first mini cycle took place between 9-10 candles, and marked the reversal with the Evening Star candlestick pattern. Next, in a larger cycle, it lasts 27 candles, and coincidentally obeys the Kihon Suchi set of numbers. This cycle also ends by a succession of Doji and Pinbar candlestick patterns, and then reverses.
The second type of cycle number, Taito Suchi.
Besides the variation in the number of cycles Kihon Suchi, there is also the variation of time in the same period, They are named Taito Suchi.

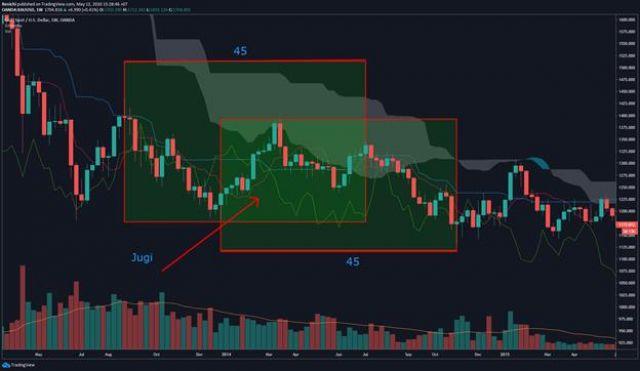
Unlike Kihon Suchi, regular periods do not necessarily follow the law of Kihon Suchi numbers. Above is an example with the GBP/JPY pair.
Two Variations of Taito Suchi
Jugi (overlap): This is the first variant of the Taito Suchi cycle. Sometimes Taito Suchi’s cycles are irregular, and there is an “overlap” interval between the two cycles, called the Jugi.
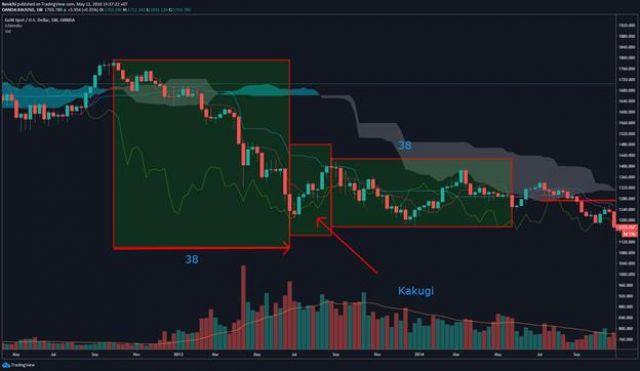
Kakugi (gap): This is the second variant of Taito Suchi. There is a gap between the two cycles, causing the Taito Suchi cycle to be modified.
The theory of time is one of the main pillars of the Ichimoku system. The potential reversal points (Henka Bi) follow the sets of numbers of this time theory. However, as I said above, the “potential” reversal zone through time theory is only “potential” in nature, does not mean that the price will completely reverse in this area. Keep in mind the philosophy Hosoda wants to achieve, which is “harmony and balance”. However, perfect balance is achieved only when all three theories: Time theory, wave theory and price target theory agree. And about these two theories, I will introduce them in the next section.